Flow Debugger
This part of the documentation is under developement.
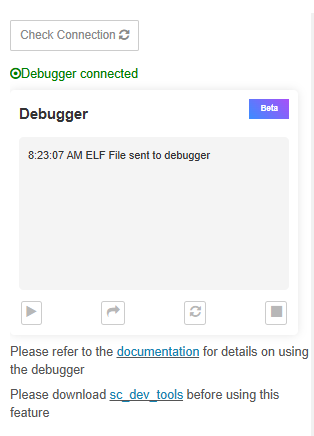
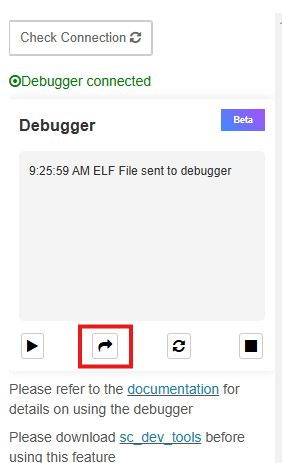
The Debugger Sidebar allows users to control the execution of their flows in real-time, providing detailed insight into how their code functions. It helps to find and fix issues faster.
- Start: Initiates the execution of the flow.
- Step Over: Moves to the next node.
- Restart: Resets the microcontroller to run from the beginning.
- Stop: Halts the execution on the target.
Prerequites
In order to use the debugger make sure you have followed these steps:
- Download the SC Developer Toolkit
- Download and install zadig tool
- Make sure you have an ESP_PROG device with you
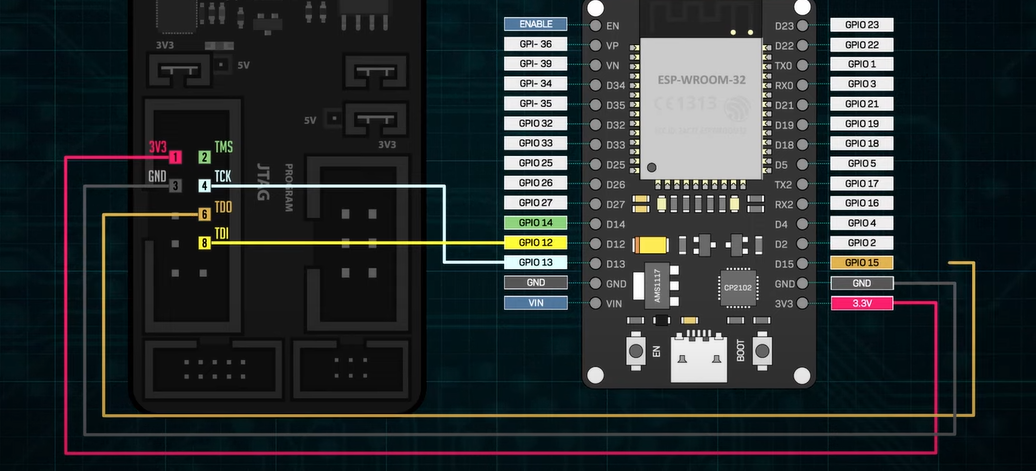
- Connect your ESP_PROG to your ESP32 as follows:
| GDN -> GND | 3V3 -> 3V3 | TCK -> GPIO13 | TDI -> GPIO12 | TDO -> GPIO15 |
 (Source: https://www.youtube.com/watch?v=uq93H7T7cOQ)
- Plug in your ESP Prog to your computer and start the zadig software.
- Select the ESP PROG device (Name would be similar to Dual RS232) and click on Replace Driver
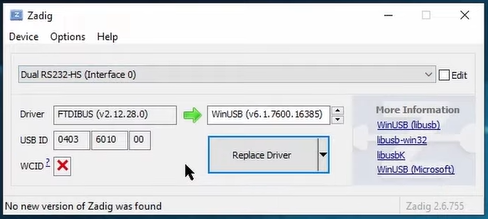
Note: If you use a different usb port next time you use the ESP Prog you would have to redo the driver installation.
-
Once the connections are setup, connect your ESP32 to your computer and Upload your flow.
-
Once the flow has been uploaded, connect your ESP PROG device.
-
Start the sc_debug_bridge executable present in the debugging folder of the SC Developer Toolkit.

-
Execute this command in a terminal while in the debugging folder:
.\dependencies\openocd-esp32\bin\openocd.exe -f board/esp32-wrover-kit-3.3v.cfg
Note: You can pass in whichever esp32 board is supported by openocd by changing the -f command. Configuration files (*.cfg) are located in dependencies\openocd-esp32\share\openocd\scripts\board
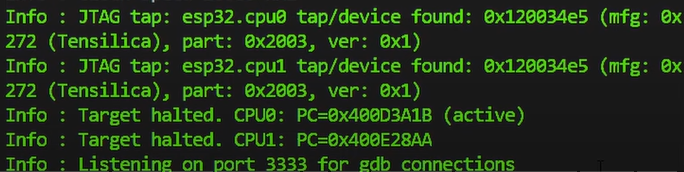
If all the connections and driver installations are correct, you should receive the following message on the terminal:
After this you can start using the feature using the Debugger Tab.
Debugging your flow
-
Go to the Debugging sidebar and click on Check Connection. It will turn green and start the communication
-
You can use the Step Over button to move ahead in the flow node by node.

-
You can also choose to stop at only specific breakpoints by hovering over a node and clicking on the breakpoint.
